A matter of data visualization

A matter of data visualization

Some time ago my boss asked me for advice on a report he just created. Here’s an example with sample data of what he liked to visualize: For different dates we have a count of objects which had a specific final status. You can reproduce the sample data using the following select statement: query-with-inline-sample-data Goal of the visualization should be to show the distribution across the different status and the overall development of the measured data. Our first approach was…
Read More Read More

Creating a report with a custom shapefile in Cubeware Cockpit

Creating a report with a custom shapefile in Cubeware Cockpit

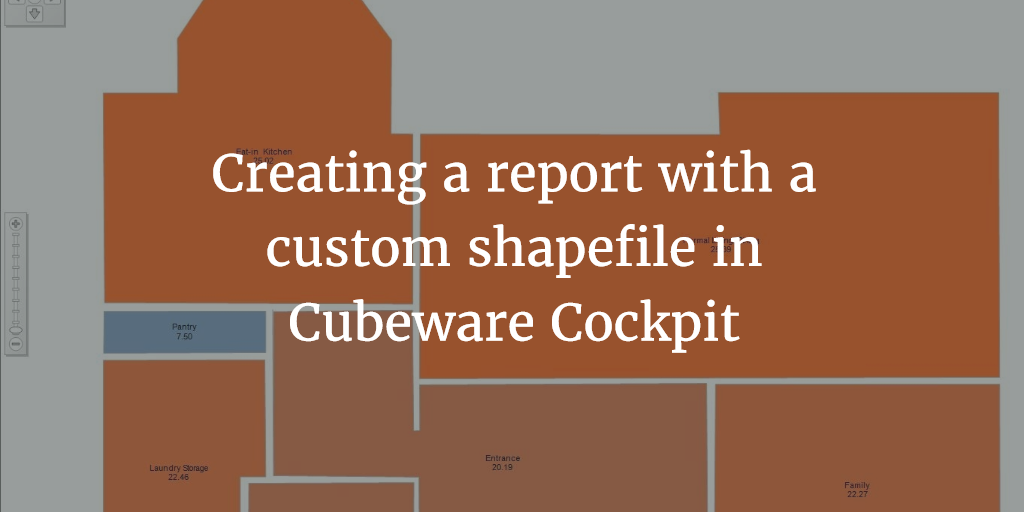
Earlier I described how to create the custom shapefile. Now I show you how to create some sample data for the report. Now let’s create a report based on that shapefile. You can grab my shapefile here if you didn’t create your own. First of all we need some sample data. Take the following script to create a database with the relevant data. The script should be compatible with at least SQL Server 2008 (nothing special there). If you are…

Read More Read More

Dirty DBA Tricks: Convince SQL Server Cluster < 2012 to use local SSD for tempdb

Dirty DBA Tricks: Convince SQL Server Cluster < 2012 to use local SSD for tempdb

As the title suggests this blog post is about a neat trick, which a decent DBA typically wouldn’t consider if he/she had other options. It worked for me and it was a well thought option to go for. I am not very proud of this trick (therefore “dirty”) however it saved my day and perhaps it’s a valid option for you to go as well. Remember that you use SQL server in a non-supported way doing this and don’t blame…

Read More Read More

Create your own shapefile

Create your own shapefile

This blog post is about creating custom shapefiles to support your own visualizations. A shapefile is a vector graphic used for visualisation of spatial data (like maps) by numerous BI frontends or reporting tools.  The blogpost was inspired by a presentation on “free visualisation with the CSP C8 Frontends” given by Matthias Jüstel and Ivo Pawlow at the Cubeware Infotag 2015 in Rosenheim. The presenters repeated their presentation in a webcast on 25.02.2016 which can be viewed on the Cubeware…

Read More Read More

A new SQL and BI blog!

A new SQL and BI blog!

Here I am…finally starting my own blog. I have been thinking about blogging for quite some time now and it is good to start it now. I am a german database and BI professional. However this blog will be in English for the following reasons: 1. I hope to attract a bigger audience by writing in English. 2. It’s a good practice for me to improve my writing skills.  For english natives: Please be kind if my English might sound…

Read More Read More