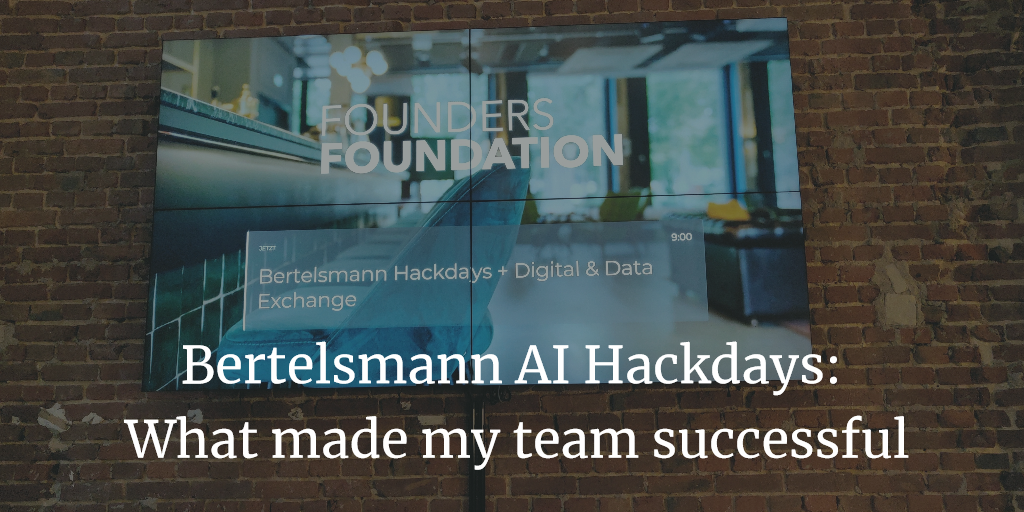
Bertelsmann AI Hackdays: What made my team successful
TLDR
Dear potential reader: I realize that this blog post is quite long and everyone’s time is limited nowadays. I am still excited about the result of the Hackdays and the solution I helped to build. So I tried to share as much as possible with you. Feel free to skip over some headings faster and delve into details in other paragraphs. My message is that contributing successfully to a hacking event is absolutely doable even if you are not a native AI hacker (read more about that in my wrap-up).
What’s it all about?
The Bertelsmann AI Hackdays took place from Monday, 7th till Wednesday, 9th October 2019 in Bielefeld (Germany). They were set up to continue the AI Hackathon in Cologne (held at September 4th 2019). Basic idea of those events was to contribute to Bertelsmann’s success via methods of AI and foster collaboration and networking across business units. You can get a small glimpse of the AI Hackathon in this video. Different business units within Bertelsmann presented cases which they would hope to solve with modern AI technologies. Most of these cases were from the media business and relied heavily on video or audio processing. My work at Arvato Financial Solutions (short AFS) however is by far not that sophisticated regarding media so I embarked on the challenge “How old is your house?” presented by AZ Direct, the company for modern campaign management in mailings and new customer acquisition. Based on its unique database AZ Direct suggests who shall be targeted in which campaign and via which channel. With the given task AZ seeks to further improve this database.
In the end my team was voted second by the audience of the Advanced Analytics and AI Expert Group Days consisting of roughly 100 people with a strong background in AI and/or Analytics. In this blogpost I would like to share some things I am proud of having achieved in these three days.
A big “Thank you” for this great event and the Hackathon goes to the organizers at Bertelsmann Corporate IT, who made this possible especially Corinna, Dorothee, Carsten and Thomas (to name just a few).
The task
As the title suggests the task was to collect data about buildings to enrich the AZ DIAS dataset and to enable better targeted campaigns. AZ DIAS is the data heart of the company and the base of their approach on data driven marketing. Improving this database with new found attributes or a profound validation of the data quality is essential for future marketing campaigns. One key example was to possibly identify attributes that allow the prediction whether a building would be perfect for a solar panel roof. For such a use case one would need the information about the type of the roof, the information whether a roof faces southwards and also if there isn’t already a solar panel installed. No such information is available on the market – but it can be obtained via the web so finding additional data that could support such a use case was one aspect of the challenge. Additionally we were also tasked to perform data validation by additional sources to sustain high data quality of the dataset. To achieve that we were provided with a small extract from the dataset and some 90k map tiles with satellite images and map information.
May the source be with you or just do your homework
First of all, I have to admit that in the prior Hackathon I was not in one of the winning teams. However I was quite astonished that the seemingly rather boring topic of address data enrichment did take it up with the other more media-focused challenges and the second team on this challenge won. Later on Bertelsmann changed its policy and invited the three winning teams, plus a wildcard team, to the second hacking event. I felt that I didn’t prepare properly for the Hackathon the first time so I took the chance to make it better this time.
A five hour train ride to the venue on Sunday was my enabler of getting prepared better.
One of the lessons learned from the hackathon was that satellite image processing is rather challenging starting with blurry pictures and possibly ending with the hard task to map one real estate to one address. Thus I started looking for alternative sources and found a real game-changer: cadastral data. Wow that’s quite a word, isn’t it? Don’t bother if you don’t know it: A cadastre is an official register about real estate and buildings owned by the state (of Germany). Lucky as I was, the cadastre relating to the data set of the challenge was already published as open data on http://geoportal.nrw. Why should we undertake a painful image recognition learning endeavour if quite a lot of the data in question were already out there in a structured standardized form?

Cadastral data from geoportal.nrw
Alternative approaches
I also thought about doing real image processing in the end as well.
You might already have asked yourself “What the heck is Martin doing with AI?” This is still quite new to me…I took some basic classes from the University of Berkeley and Microsoft two years ago and am still mostly a DWH data professional with skills in data integration and data viz. However I can see that AI and data science are tools to answer more sophisticated questions and getting to understand your data more thoroughly. In the end one major part seems to be the same data cleansing or data munging.
So long story short: A funny thing is that in the very basic edX course Python for Data Science by UC San Diego I am currently taking they were talking about satellite image analysis (to detect wildfires) and teaching me how to take images apart pixel by pixel. One thing I thought about was to do an analysis like “How green is your tile” instead of “How old is your house” counting the percentage of “green” pixels in a satellite image. This is something I hope to achieve in the next weeks and share with you here….however this idea did not make it into the challenge at the Hackdays.
Working at the Hackdays
So much about the merits of a bit of preparation. Now I would like to share with you how the Hackdays went on from my perspective.
Monday: Teambuilding and mission alignment
On Monday Morning all teams arrived at the lovely Founders Foundation in the heart of Bielefeld. We started with teambuilding: Due to the team participation limit, from around 50 attendees at the Hackathon only roughly 20 were present at the Hackdays. There were some colleagues who had to cancel with short notice due to business constraints. So at first I found myself standing together with Nick Borgwardt (RTL, Mediengruppe Deutschland), the only participant from the other AZ Direct team from the Hackathon. Then we managed to convince Sven Teresniak (smartclip) to join our team and started out as the smallest team with just three team members. The other teams had four team members and one of them even as much as six. In my view that was not to be seen as unfair as the challenges really were quite different as well. The challenge with the biggest team was one of the most challenging ones as well ;-).

Team AZ Direct (from left to right): Sven Teresniak (smartclip), Martin Guth (3C Deutschland GmbH, Arvato Financial Solutions), Nick Borgwardt (RTL, Mediengruppe Deutschland),© Sven Teresniak License CC-BY-SA
Then we met with our sponsor. One nice anecdote is that even as we were the smallest team we did have the highest number of (four!) sponsors. Could be a sign for unfairness again but you have to take into account that our sponsors changed between days and not all four were present at the same time. So uh what does a sponsor do? The sponsor basically is the owner of the business case and a sparring partner for questions about the data provided or how the solution might fit in the overall business use case of the company. On the first day we met Frederike.
Roughly until noon we discussed business cases with her to be sure to align our solution with the business needs. It turned out, that the cadastral data were indeed a great source for the business need. We also discussed some solutions from the Hackathon before and the idea “How green is your tile?” but turned them down in favour of the cadastral data.
At noon Founders Foundation took care of our nutritional needs and provided a salad buffet. I did find some bakery for my own needs as I wasn’t that keen on eating salad (albeit it’s preferable regarding a healthy diet).
In the afternoon we did quite a lot digging and poking around the various cadastral data sources. There are quite a lot of structured and standardized data from ALKIS around. However the learning curve on how to interpret that data turned out to be very steep. There are a lot of keys around which need to be translated and we couldn’t really make sense of the data on our own. Also access to documentation on ALKIS turned out to be challenging. So in the end we choose to process building data in the City GML Standard which was much more self-explaining. We then did some validation and area calculation based on polygons of buildings.
Meeting the other teams again in the plenum we finished the working part of the day with an agile check-out. Each team answered questions like:
- What was the day like for us?
- What did we accomplish today?
- What are we planning to do tomorrow?
The check-out was first discussed within the team and then one speaker presented the feedback from the team in a five minute talk to the plenum. I did volunteer on the first day to do this and already got some good feedback on my presenting style. While the Hackdays were held in English language we decided to speak German within our team as we were all Germans. So it turned out my teammates were quite thankful that I took the challenge to talk in English.
One great thing about the Bertelsmann Events (Hackathon and Hackdays) is that we were taken care of well. In the evening all were invited to dinner at a local Brauhaus (compared to Cologne there was only one in Bielefeld :-)). Dinner was a great time for networking. Unfortunately the food was so so…the one half of the table had “Schweinebraten” including me which did not meet their expectations, the other half did choose a simpler “Schnitzel” which got quite good ratings. At dinner table I was impressed that most of my companions had quite a decent academic background (Master’s Degree, Doctorate (one of them an aborted doctorate)). I started out my career with a bachelor’s degree and have not met a barrier in career advancement yet.
Tuesday: Pushing things forward
The second day at the Hackdays was definitely the longest one. We started in the plenum at 9 am with an agile check-in answering questions like “What are we planning to achieve today?” Then we met with our mentors Peter and Kirsten. They were already excited to hear more about “this mysterious new source” and after we briefed them, they were even more excited about the possibilities and gave us the strong feedback that we were definitely on the right track. Now all three of us on the team wanted to put things in motion and get forward with our mission. So Sven started working at the XML parser to extract and calculate our new attributes from the Building Data in City GML, Nick discussed further uses of that data for the business with Peter and I already thought about a demo of our solution.

One thing I learned quite clearly from the Hackathon is that you have to sell your solution and ideally present a convincing live demo. Just opening up a csv in a text editor or even Excel will not do the trick. None of us was comfortable enough to set up a demo web page like other teams had done at the Hackathon. Therefore, I quickly concluded that I could add the most value to our project not by learning to hack Python with my beginner skills but to put my expert knowledge about BI and data viz into the equation and deliver a convincing data demo. Additionally I wanted to play a bit with Microsoft PowerBI for quite some time now but never had the right project and time to do that so I combined these two things and started working on a local PowerBI solution in PowerBI Desktop. The great thing about PowerBI Desktop is that it can be used even commercially for free and allows standalone report development.
I first defined my target data structure and filled a mock dataset on which I would test my reports until I had real data to play with. Then I had quite a rough start into PowerBI modelling…so in theory you could do all types of conversions and datatype mapping in PowerBI itself and just attach CSVs or so…in practice I gave up fiddling with it after a few try and error approaches and rather concentrated on getting data imported nicely in a SQL Server table and then consume it from there taking advantage of the type mapping done automagically. One lesson I definitely learned: If you are under pressure regarding time you tend to use the things you are most comfortable with…in my case I ended hacking TSQL at an AI hackathon…wow what a turn but hey “the ends justify the means” isn’t it so?
Throughout the day, Kirsten and Peter had to leave us and we were on our own for a few hours which was not that bad as we had a clear plan on what to do. Before Peter left he arranged a contact to AZ Direct in order to cleanse and respectively normalize the address data we retrieved from the building XML data. In the early afternoon we had a first extract of all addresses which we then sent to AZ Direct. A couple of minutes later we received our export cleansed and already enriched with GEBAUEDE_IDs from AZ Direct. It turned out that only 2% of the addresses had no match. Later on we got to know that this indeed was a really good value in comparison to most of the address cleansing AZ Direct typically does provide. So what we originally found could be a challenge namely joining the AZ dataset and our new dataset turned out to be a walk in the park.
The parser was already finished and we went on mass parsing the 2.6 GB of building data in City GML standard. We started out on the local machine of Sven but soon realized that we would need some bigger hardware (the ETA was about 48 hours…clearly the Hackdays would have been over by then). Fortunately enough Sven could tap into his company’s resources and spin up a 32 core VM which then completed all the processing in roughly 2 hours.

Later on Michael from AZ Direct joined us (this was now the fourth mentor we got to know) and was quite impressed of the new dataset and our progress so far. We also did quite a bit of data validation that day like is the size calculated for the ground of the building plausible and so on.
Sneak peek at the data
One interesting finding was that in fact we were dealing with open data about each and every building. The majority of data was about residential buildings and carports but we also found farms, industrial buildings and exotic things like “cage in a zoo”.

We also got various Roof Types with the data. This information is especially valuable regarding the possible usage of solar panels.

Distribution of Roof Types
A funny moment was as Sven said “Anyone would like to see a building with 1000 edges?” and I immediately thought “What the heck is that? Sounds like garbage data to me”. It turned out that these 1000 edges indeed described a small silo which was round in reality:

Finishing off
Soon came 6pm and we did again the group check-out in the plenum. This day however was announced as open end coding pizza night, so we had some pizza and stayed a bit longer. As it got dark outside I realized that this day already was quite tough and if you were around you could have heard a few WTF from me as my impatience with the PowerBI solution grew a bit. However I managed to import all data and prepare some nice visualizations on Map Data as well as on hierarchical data. “Open end” then was hit much sooner than expected as we had to leave Founders Foundation at 9pm. I went to my hotel and worked at the bar until it closed as well at 10pm and later on in my small room (on the bed :-/) until midnight. Literally by the end of the day I had all data prepped, joined together and visualized nicely in Power BI.

Wednesday: Finishing touches and showtime
I had a decent sleep that night and woke up just in time to have a little breakfast and get to the Founders Foundation again at 9am. This day we had an upgrade to a proper conference room, as the Founders club (where we stayed the first two days) was now in use for the Advanced Analytics and AI Expert Group Day. Working and (particularly) seating infrastructure got better day by day J: We started off in some armchairs and couches at a bar table on Monday (not comfortable for work at all), went over to a decent table with school-like wooden chairs on Tuesday and finally had our own little creative realm on Wednesday. Call me sensitive or old-school but for me in order to perform well at work I really do need good seating and a calm surrounding rather than sitting in an armchair listening to energetic music in the background (at least the volume was immediately turned down the moment I asked for more tranquillity).
And now for machine learning
Frederike (our mentor from Monday) was around again to assist us and we started with a review on what we got and what we would like to achieve. The end of the day was already set to 6pm as this was the time the pitches would start. A lot of puzzle pieces already were put together but we hadn’t yet performed any AI. A great use case however was already present: The new data had an attribute called number of floors for a building…however this attribute was only present for about 10% of the data (for residential buildings). Talking to Frederike we quickly confirmed that this attribute would really make sense and embarked on a challenge to perform some machine learning on it to fill the gaps. We started out setting a baseline. As our data were of a mid-sized city it was not surprising that the most prevalent number of floors (ground floor excluded) was 1 resulting in a building with ground floor and top floor (typical for a fully detached house). So if we would just assume 1 for each gap we would have guessed right about 63% of the time. This calculation of course was conducted on a decent sample of the 10% of the data which we had the number of floors present. We discussed what ML algorithms to learn and quickly concluded that random forests would be well suited for the problem. Why is that so?
Some technical details of the random forest model in cat boost are: iterations=100, depth=2, learning rate = 0.03 and loss function “logloss”. Target for the calculation was the number of storeys. We optimized the model by accuracy. I’m happy to take questions on the details but will forward them to my colleagues Nick Borgwardt and Sven Teresniak.

In the meantime I was busy polishing the PowerBI dashboards a bit, doing another round of validation and identifying two interesting objects for the live demo. Frederike hat to leave at noon but meanwhile Michael and Peter had joined us again for the final preparations.
So we had a small break for lunch and then switched focus to working on the pitch. Timing constraints were a bit loosened compared to the Hackathon giving us 4 minutes time to present the case and 10 minutes time for our solution.
From the beginning it was a key objective for our slides to contain as less text as possible (you don’t want the audience to start reading what you are saying anyway) and to be as few as possible. We ended up with 9 slides leaving us enough headroom for the live demo. Michael and Peter assisted us in a great way just as mentors should. They challenged us with questions regarding the slides enabling us to better distil the relevant parts out from unnecessary noise. Additionally we got some hints regarding the storytelling. In the end we built the presentation ourselves as it should be but we really got good mentors and coaches. It was a great spirit in that conference room around teatime as our pitch became more and more shape and everyone was enthusiastic working at it. It impressed me much that Peter and Michael stayed with us until pitching time. They could have attended interesting talks at the ongoing Advanced Analytics and AI Expert Group Day, which was running parallel to our Hackdays, but they turned them down in order to be with us in that pitch preparation.
Roughly 45 minutes before the pitch everything was prepped. The slide deck was ready, the PowerBI demo anyway and my team quickly decided that I should be the presenter. Wow…I was getting quite nervous but said “OK I could do this”. We had about three walkthroughs of the pitch in which I got more and more confident. Best thing was that even in the first round when I was sometimes searching for words or struggling with transitions between slides I got the feedback “You are quite good regarding timing”. “Really, perhaps I am speaking to fast so nobody could follow?” I replied. “Nope, everything’s great” I got in return by my teammates. Man did I grow nervous those minutes….pitching time was just around the corner…originally we were said to be in the plenum at 17:30 but still sat prepping in our room until 17:50. Finally we decided to go down and I thought “OK take a deep breath…head to the toilet once more and off you go”.
Finally reaching the Founders Foundation a mate from another team asked us if his hacker shirt was sitting well enough. This was incredibly helpful to me to see that others are just quite as nervous as well and I gave him a slap on the back saying something like “You look perfect….one time hacker…always hacker” (HACKER was printed on the front side of the shirt).
All Hackers gathered at the back of the room and pitching started. Two teams presented before us. The first presenter had the most challenging pitch I think and he started off quite nervous searching for some words. However he did amazingly well in the end and found into his own flow, which was really great to observe.

Then it was showtime for us, we went in front and I plugged in my notebook:
The start went well…on slide 2 or 3 I was searching for a word (and got a nice prompt from Sven) and then it just was pure joy of presenting to me. I didn’t think that I could be funny but apparently the audience seemed to enjoy it very much and every minute or so we had a short period of laughter. Perfect! So I started to improvise….reaching my live demo I had left my mouse on the other side of the room and said “Oh now I forgot my mouse and have to walk over again…anyway…keeps me fit” and earned one pleasant laughter again. The live demo went incredibly well too even though I didn’t even have the chance to practice it thoroughly beforehand! As time was over with a loud “beep” from the timer I confidently closed the pitch with a comment “And now time’s catching up….here are our next steps for you to read and thank you for your attention” finishing right in time.


Afterwards we watched the presentation of the last team and community voting started. It was performed via an event app and the audience did choose one team in each of the following categories:
- Results – Which team presented the most mature solution?
- Business potential – Which team presented the best case in terms of its business impact?
- Tech potential – Which solution presented the best solution in terms of its technological feasibility and implementability?
- Teamwork & Storytelling – Which team delivered the most convincing pitch?
I saw colleagues from other teams voting as well and noticed that my team was scoring quite well. However in that moment I was simply too exhausted to vote myself and also thought “let the audience decide”. Along the days we often had a conversation in my team like the following:
“Oh wow we do really have a case which brings our mentor’s business significantly forward and helps them to provide better analyses.”
“However, the other teams do really have great stories and are by far doing much more regarding AI and fancy stuff which even brings people with non-technical background to applaud. Probably we won’t be much successful in the pitch.”
The most surprising result for me was the following:
- Two teams were voted on place 3. This is a great way of showing that each and everyone’s effort was great and deserves to be rewarded. There is no absolute looser in the game.
- More surprisingly my team was not given place 3 so excitement grew. Participating at the hackathon I was struck by disappointment not being among the awarded teams. However this time I clearly set less expectations just to be surprised on making place 2!
Hey wow, that’s absolutely great. In the end the audience really seemed to appreciate the maturity of our solution and for sure the entertaining and convincing pitch lead to a few favours as well.
Regarding prizes there was nothing special about place 2 and 3. Everyone was handed out a book (let’s see when I get to reading it being a young father ;-)). However it is absolutely invigorating going to the Hackdays, starting with the smallest team and also starting over with the project work not just recycling something from the hackathon and ending up (putting it statistically) in the second quartile of all teams.
Now what about the winning team you might ask…in my view they absolutely deserved it. They had a media intense case, were the biggest team (with 6 people) but also had one of the most challenging cases I would not have dared to touch. They won a one year subscription for Coursera…a great way of investing into knowledge.


Wednesday Night: Celebration
So “Work hard, celebrate harder” they say, isn’t it? To be honest I am not the classical party guy but that evening it made absolutely sense J. All were invited to an exclusive evening event at NUMA Restaurant in Bielefeld. NUMA…funny I found…as a tech person you clearly know what that means, right?
It was a great evening and the chance to get into contact with a lot of interesting people from data and AI divisions all across the Bertelsmann Universe. I was stunned to hear comments like “Wow such a great pitch. I am your biggest fan” from a BMG colleague. Not the kind of conversation I am used to but it makes one proud indeed. I also heard quite often “Wow great presentation. If it hadn’t be for the other more appealing media-related topic you would have won.” Not bad for your self-confidence either ;-).
It was great to get to know the Bertelsmann Data Community at that event and I really took advantage of the chance to meet as many people as possible not staying at one table forever. One of the most impressive people I met was Klaus-Peter from AFS. It was indeed him to approach me first saying “So you are Martin Guth. Nice to finally meet you.” He is currently in charge of an exciting data strategy project at AFS regarding Strategy for Data and Analytics. I filled out some questionnaires regarding data at my company and answered the question “What’s your current role?” with “Analytical Swiss Knife”. I borrowed that phrase from Mico Yuk and it reflects my current situation perfectly: I started out in BI (>10 years from now), took over additional duties as a DBA (especially performance tuning) later on and am now eager to take a dive into the new and shiny “AI pool”. It turned out that he loved that comment from the start and we had a great conversation that night. Afterwards everybody was invited to a photo shooting for profile pictures to a new collaboration platform. He encouraged me to take all role-cards because that’s what a swiss knife does, isn’t it? So here’s the result….enjoy:


Wrap-Up: Don’t be shy, give hacking a try!
Dear reader, congratulations that you have been staying with me so far. It’s definitely a long post I wrote but IMHO it is definitely worth sharing. I guess you got the overall story: New kid with just basic knowledge in AI goes to AI Hackathon is one of many then comes back to AI Hackdays and learns that he can make a difference and push his team forward to the second place. I tell you: If I can do that, I am sure you can do it as well.
Let me finish with a view on what a modern data scientist should be like. I first saw this in the edX course Python for Data Science. It seems that as a data scientist you should be something like the crossing between business communicator, domain expert, statistics buff and programmer.

To quote Ilkay Altintas (Chief Data Science Officer at the University of California San Diego, USA) from the edX course “Python for Data Science”(Video “Why Python for Data Science”):
“That’s a lot of skills to have for a single person. […]Some folks have even begun to ask if data scientists are like unicorns, meaning they don’t exist. […] So in reality, data scientists are teams of people who act like one. This is why we say data science is team sport, referring to the breadth of information and skills it takes to make it happen.”
You can be part of the team and you can help to set things into motion. Call to action: Apply for the next data event like a hackathon, do your homework in advance and contribute. You can get to know great people and learn a lot (most surprisingly sometimes not about tech).
I am looking forward to meet you at such an event in the future or at the Udacity Tech Scholarship
One thought on “Bertelsmann AI Hackdays: What made my team successful”
Nice summary. Thanks. 🙂