Create your own shapefile
This blog post is about creating custom shapefiles to support your own visualizations. A shapefile is a vector graphic used for visualisation of spatial data (like maps) by numerous BI frontends or reporting tools. The blogpost was inspired by a presentation on “free visualisation with the CSP C8 Frontends” given by Matthias Jüstel and Ivo Pawlow at the Cubeware Infotag 2015 in Rosenheim. The presenters repeated their presentation in a webcast on 25.02.2016 which can be viewed on the Cubeware website. I took their basic idea and did it myself with a different scenario: Jüstel and Pawlow showed a visualization of an urban development plan (“Bebauungsplan” in German), I decided to do the same thing with a floor plan visualising room temperatures (could be a nice add-on for some home automation gurus 😉 ).
To create shapefiles we’ll use the free software QGis. Download it from the website and install it on your computer. I used version 2.14.3 (Essen) for this example.
To create a custom shapefile it is helpful to have an image first. My example is based on a sample floorplan from Wikipedia. Download this image in full resolution.
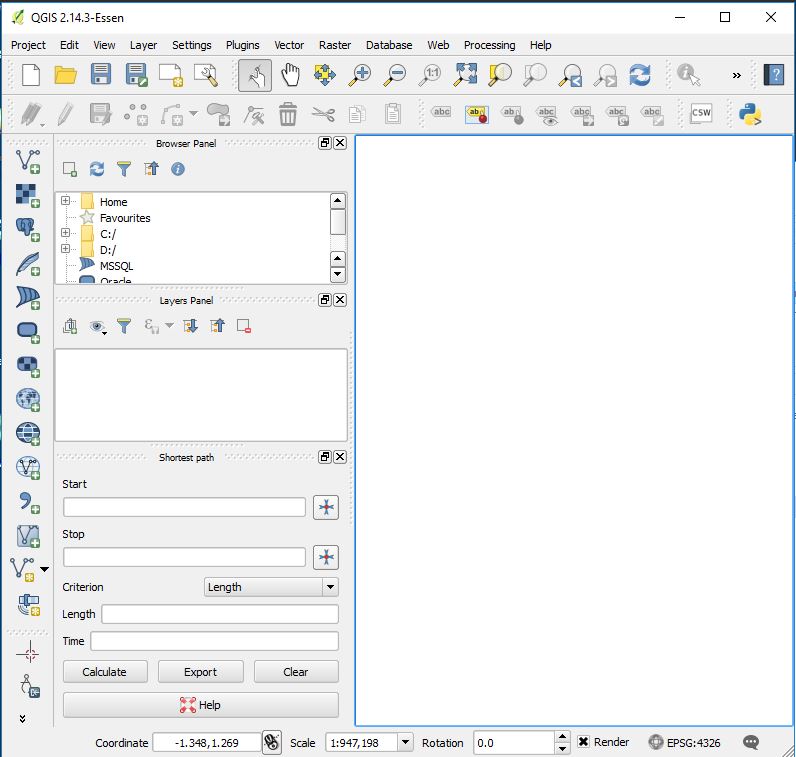
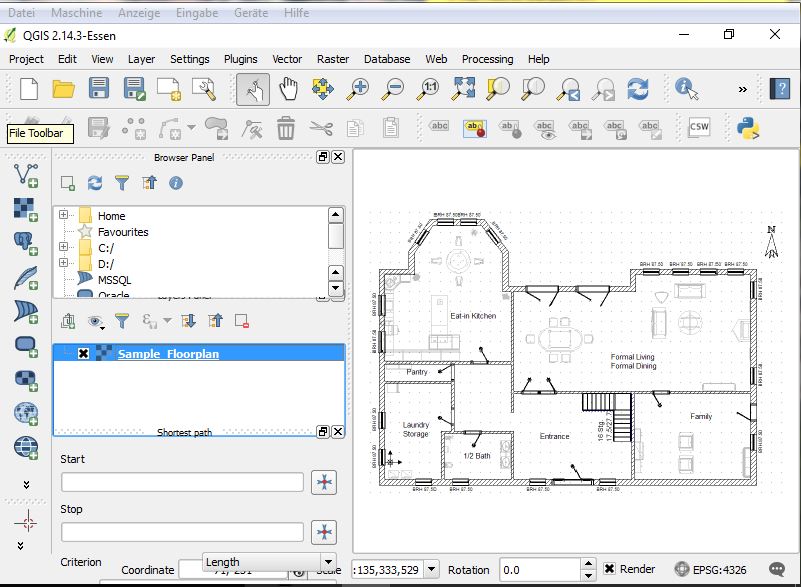
Then open up QGis Desktop and create a new project (Ctrl+N or Menu Project->New).
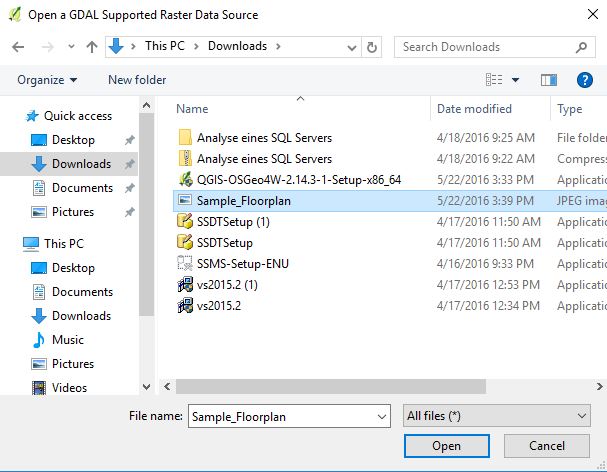
Next, add a raster layer (Menu Layer -> Add Layer -> Add raster layer). A dialogue “Open a GDAL Supported Raster Data Source” will show where you select the image of the floorplan you previously downloaded from Wikipedia. This will be the image we create the shapes on.
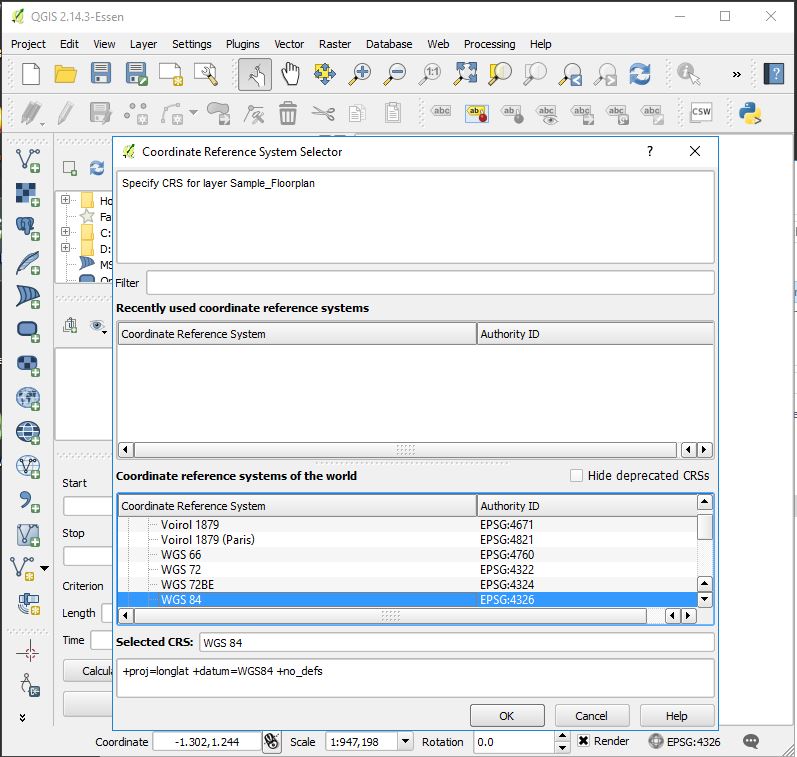
The following dialogue might appear as cryptic as the first one to GIS and Shapefile newbies. It’s title is “Coordinate Reference System Selector”. As far as I understand it (and I’m way from being a GIS expert) there are different ways to describe coordinates on a Shapefile. Just leave the default “WGS 84” and confirm with OK. You have to make the same configuration on the Shapefile as you import it into your reporting tool (e.g. Cubeware Cockpit). Please note that not all reporting tools might support all of the different coordinate reference systems-
Well, the first hurdle is now taken and you should see a layer called “Sample_Floorplan” with the floorplan image in QGis now:
Next we to add a Shape layer. This will be the layer the shapes are drawn on. It is added via the Menu Layer -> Create Layer -> New Shapefile Layer. The type will be polygons. In addition to the compulsory ID column the shapefile will contain attributes for room name and room size as well.
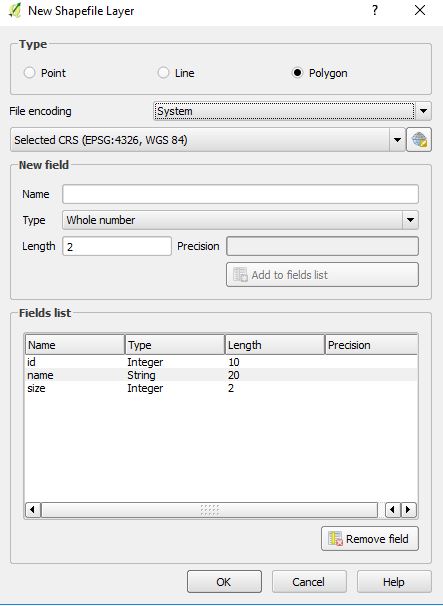
Next we specify the location our shapefile will be saved.
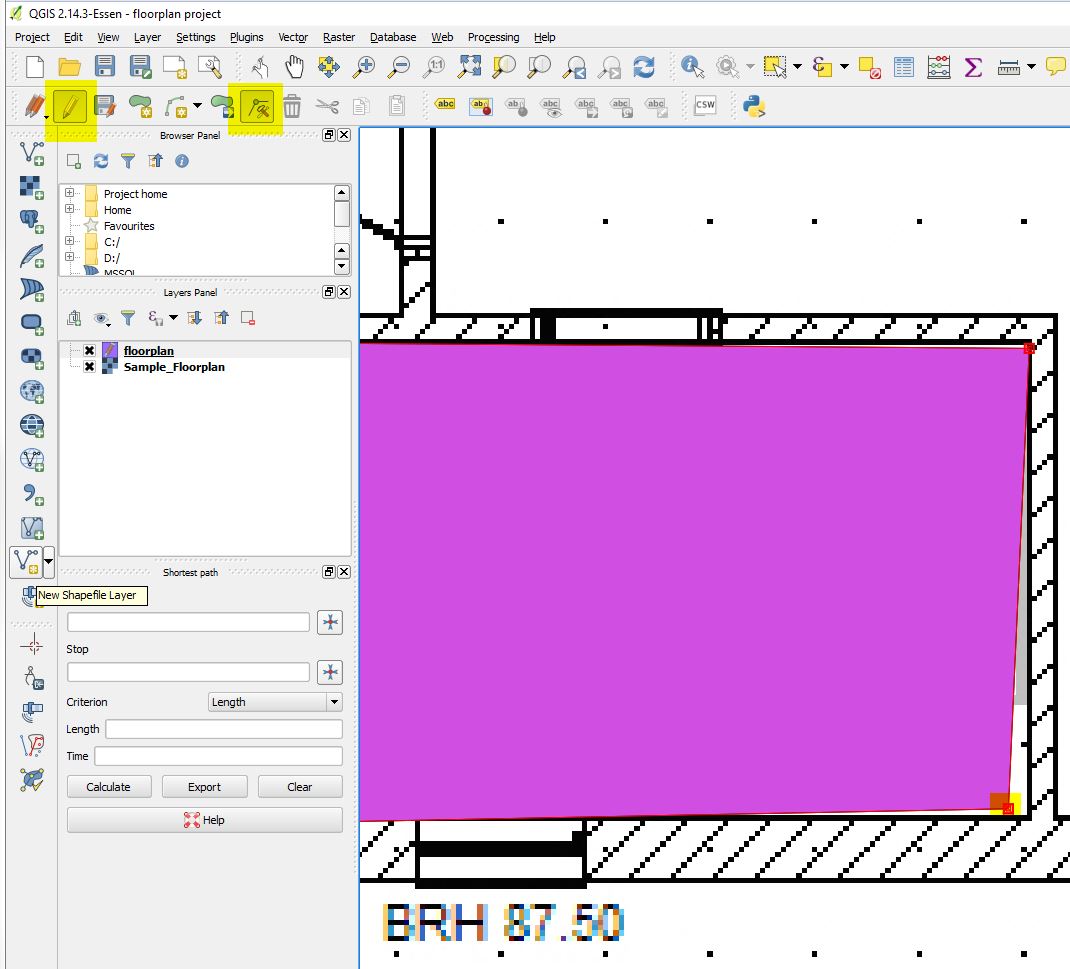
Now we are ready to start drawing the shapes. First, change into editing mode by clicking on the pencil symbol or via menu Layer->Toggle Editing.

Then click on the symbol for “add feature” or via menu Edit -> Add Feature.

Now you can start drawing shapes by clicking on the edges. The shape is then filled by a light red. You don’t have to be ultra-precise at this stage as you can make adjustments to shape size later. If you are finished with one shape click right once and provide values for the attributes in the following window:
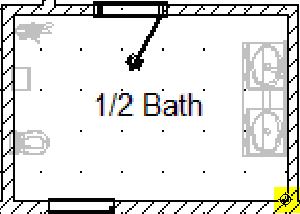


Afterwards the shape creation is shown by a filled shape (with the colour of your layer):

Now zoom in into the shape you’ve created. Perhaps the points are not as precise as they could be. This can easily be corrected using the Node Tool in editing mode (Menu Edit -> Node Tool or see screenshot). Now you can click on the edges and reposition them appropriately.

Meanwhile, don’t forget to save your whole project.
Now repeat these steps for every room (if you are eager to practise) or skip this tedious task using the shapefile I have provided at the end of the blog. The attributes have to be set as follows:
| id | name | size |
| 1 | Eat-in Kitchen | 20 |
| 2 | Formal Living&Dining | 30 |
| 3 | Family | 15 |
| 4 | Entrance | 18 |
| 5 | ½ Bath | 8 |
| 6 | Laundry Storage | 10 |
| 7 | Pantry | 4 |
With more complex shapes like the Entrance simply keep on adding each edge one after another.

At the end your project should look like this:

Your shape file is now ready for use.
For your reference or convenience you can find my QGis Project Files here:
Stay tuned for the next two blog posts describing test data creation in SQL Server and report creation in Cubeware Cockpit.
4 thoughts on “Create your own shapefile”
Inspiring story there. What occurred after? Thanks!
Hi Cazare,
I built this shapefile for a sample data visualization. I described the process of visualizing data here: http://www.martinguth.de/uncategorized/creating-a-report-with-a-custom-shapefile-in-cubeware-cockpit/
Thanks for making the sincere try to give an explanation for this. I think very robust about it and wish to learn more. If it’s OK, as you reach extra in depth knowledge, might you mind adding more posts very similar to this one with additional information? It might be extraordinarily useful and helpful for me and my colleagues.
I just want to mention I am new to blogs and absolutely liked you’re web page. Probably I’m going to bookmark your website . You really have impressive posts. Bless you for sharing your website page.