Monitoring Power BI Report Server Execution Status with a Paginated Report
Keeping an eye on your Power BI Report Server jobs can be a bit of a black box—until now. To make monitoring easier, I’ve built a paginated report that lists all ReportServer jobs, including both automated data refreshes and subscriptions for paginated reports.
Big thanks to P. Theriault for the error criteria inspiration and to Alexander Korn for laying the groundwork with the base view!
What the Report Does
The report pulls job execution data from the ReportServer database and provides filters to quickly identify failed executions. Whether you’re troubleshooting a broken subscription or just want to keep tabs on your scheduled jobs, this report gives you a clear overview.
Installation Steps
Here’s how to get it up and running:
- Download the files
- Create the View
In your ReportServer database, create a view namedRSJobMonitoring. - Grant Permissions
Make sure the appropriate users haveSELECTpermissions on the view. - Configure the Report
- Open
ReportServerJobs.rdlin Report Builder. - Change the data connection to point to your server.
- You might need to adjust the credentials (default is “Use current Windows user”).
- Preview the report and save it.
- Open
- Upload to Report Server
Log in to Power BI Report Server and uploadReportServerJobs.rdlto a folder of your choice.
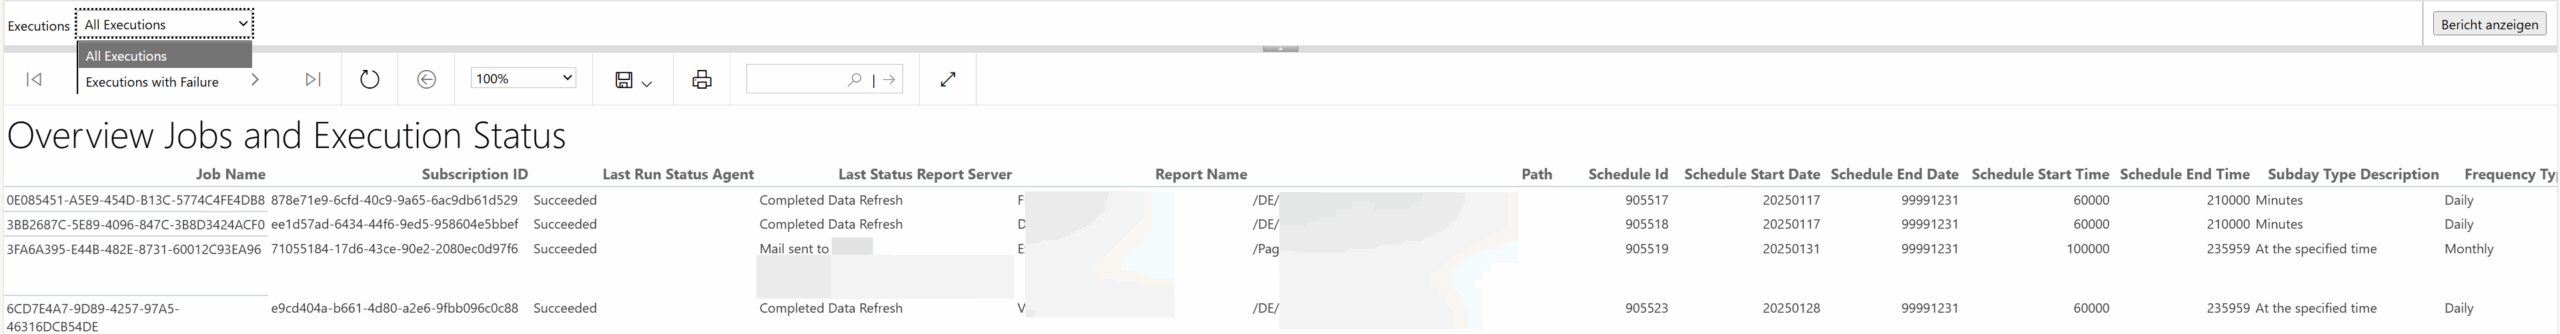
Report Columns Explained
Here’s a breakdown of the columns included in the report:
- JobName: The name of the SQL Server Agent job (usually a GUID).
- SubscriptionID: The ID of the subscription in the ReportServer database.
- LastRunStatusAgent: Status of the last SQL Agent job run (can be “Succeeded” or “Failed”).
- LastStatusReportServer: Status of the last subscription execution in Report Server.
- ReportName: The name of the report (could be paginated or a Power BI report).
- Path: The folder path of the report in Report Server.
- ScheduleId: The ID of the schedule in the ReportServer database.
- ScheduleStartDate: First execution date of the schedule (format: YYYYMMDD).
- ScheduleEndDate: Last execution date of the schedule (format: YYYYMMDD).
- ScheduleStartTime: Time of day when the schedule starts.
- ScheduleEndTime: Time of day when the schedule ends.
- SubdayTypeDescription: Describes the sub-day frequency (e.g., “Minutes” or “At specified time”).
- FrequencyTypeDescription: Describes the overall frequency (e.g., “Daily”, “Weekly”, “Monthly”).
- FrequencyIntervalDescription: For weekly schedules, this shows the day of the week (e.g., “Friday”).
- FrequencyRecurrenceFactor: Indicates recurrence (e.g., “Every 2nd week” or “Every 3rd month”).
- NextRunDateTime: The next scheduled run time.
- LastRunDateTime: The last time the job was executed.
- Description: A user-defined description of the subscription.
Monitoring Use Case
You can also use the view directly for monitoring. Here’s a quick example to list reports with errors:
SELECT errorCount, CONCAT(errorCount, ' Report(s): ', ReportNames) AS errorText
FROM (
    SELECT
        COUNT(*) AS errorCount,
        STRING_AGG(ReportName, ',') AS ReportNames
    FROM dbo.RSJobMonitoring
    WHERE
        -- Job has Error
        (
            LastRunStatusAgent <> 'Succeeded'
            OR LastStatusReportServer LIKE '%Fail%'
            OR LastStatusReportServer LIKE '%Error%'
            OR LastStatusReportServer LIKE '%The e-mail address of one or more recipients is not valid.%'
            OR LastStatusReportServer LIKE '%Thread was being aborted.%'
        )
        OR NextRunDateTime < DATEADD(MINUTE,-30,GETDATE()) -- Next run is overdue
) srv
;
This query gives you a quick summary of how many reports failed and which ones they are.
Disclaimer
This article was created based on my personal notes with support from Microsoft Copilot. While Copilot assisted in structuring and refining the content, all technical details have been carefully reviewed and developed by me.