#tsql2sday: When the Optimizer Runs Out of Time

This post is my contribution to T-SQL Tuesday #200, inspired by Brent Ozar’s invitation on the topic“When I’m looking at a query, I bet it’s bad if I see ____.” Brent challenged the SQL Server community to share the warning signs that immediately raise concerns when reviewing T-SQL code and to explain the problems they have caused in real-world environments. In this post, I take a closer look at EarlyAbortReason and the Optimizer Quantum as potential indicators that a query may be more complex—and potentially more problematic—than it first appears
Original invitation by Brent Ozar
As a database administrator and BI engineer, I have developed a simple rule of thumb over the years:
Whenever I see a query with more than ten joins, I become suspicious.
That does not automatically mean the query is bad. Sometimes complex business requirements require complex SQL. However, there is a point where complexity starts working against both developers and the SQL Server optimizer.
The Hidden Cost of Complex Queries
Many developers focus exclusively on execution time. A query that runs in two seconds is considered good, while one that runs in twenty seconds is considered bad.
What is often overlooked is that SQL Server also needs time and CPU resources to generate an execution plan before it can execute the query.
Modern database systems face an enormous optimization challenge. Every table can have multiple indexes. Every join can be performed in different ways. The optimizer must evaluate countless possible combinations and decide which plan is likely to perform best.
Fortunately, SQL Server is designed to do this efficiently. Execution plans are cached and reused whenever possible. This saves a tremendous amount of CPU time because plans do not have to be compiled repeatedly.
Most of the time this works extremely well.
Sometimes it does not.
A well-known example is parameter sniffing. SQL Server creates a plan based on one parameter combination and then reuses that same plan for completely different parameter values. What worked perfectly in one scenario may perform terribly in another.
The Optimizer Has Limited Time
One interesting detail that many SQL Server professionals are unaware of is that the optimizer does not have unlimited time to search for the perfect plan.
Internally, SQL Server works with optimization time budgets. If optimization becomes too expensive, the optimizer eventually stops searching and uses the best plan it has found so far.
When inspecting execution plans, you may encounter the following attribute:
StatementOptmEarlyAbortReason=”TimeOut” respectively Reason For Early Termination (in the Properties Pane of the SELECT Operator)
Here are some valuable resources to continue learning:
https://erikdarling.com/a-little-about-optimizer-timeouts-in-sql-server/
https://www.brentozar.com/blitzcache/compilation-timeout/#:~:text=Complex%20queries%20can%20take%20a,set%20to%20%E2%80%9CTime%20Out%E2%80%9D.
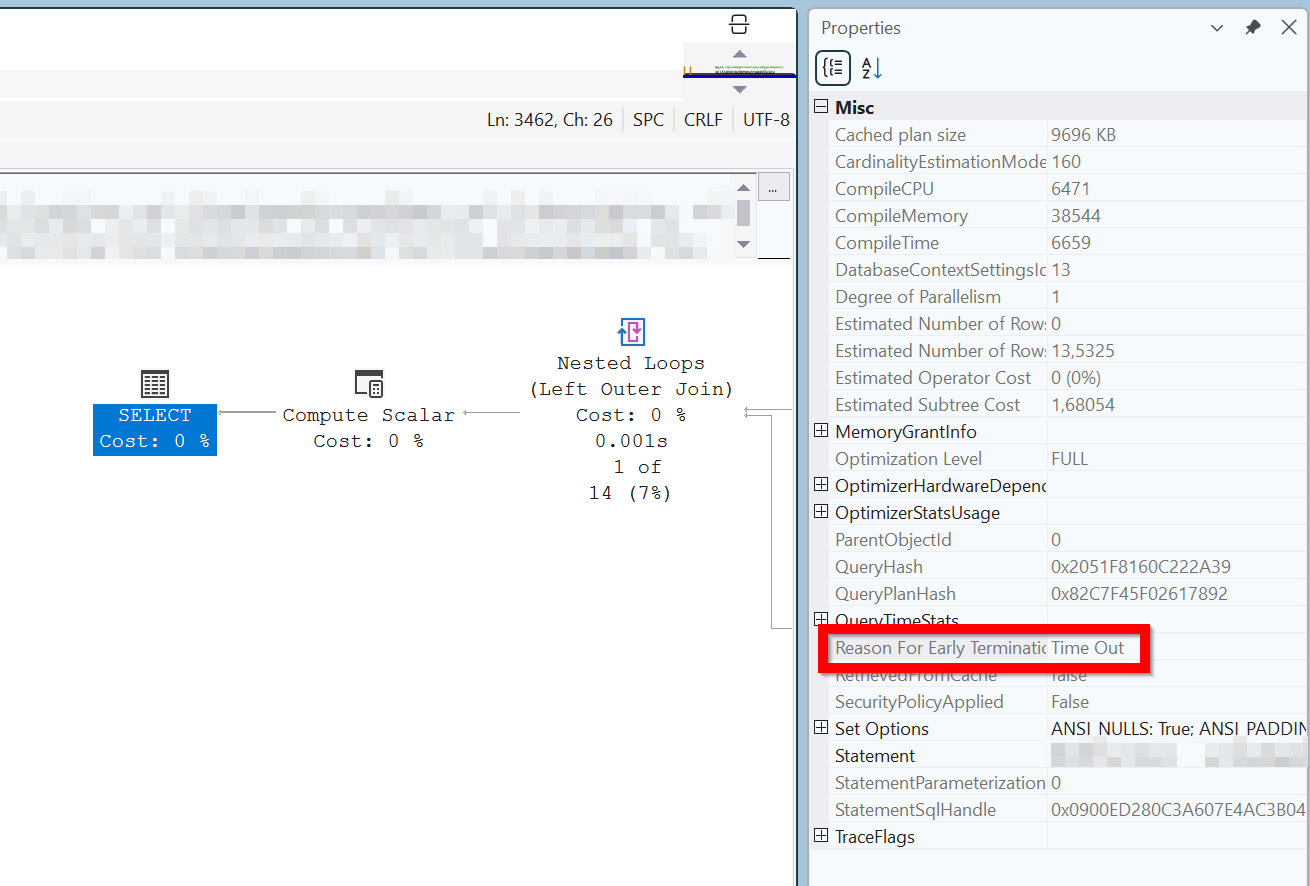
This indicates that the optimizer stopped exploring additional alternatives before completing its full search.
The plan may still be perfectly acceptable. However, it may not be the best possible plan.
Personally, I have often wished Microsoft would expose a setting allowing DBAs to increase the optimization budget from a few milliseconds to perhaps 10, 20, or even 50 milliseconds for specific scenarios. Unfortunately, this behavior is deeply embedded in the optimizer and cannot be configured.
As query complexity increases, the likelihood of reaching these optimization limits also increases.
My Early BI Engineer Years
As a junior BI engineer, I followed a very common pattern.
I tried to build a single massive query that contained everything.
One gigantic SELECT statement.
One gigantic join tree.
Every business rule embedded in the same query.
The result was often more than 2,000 lines of SQL code.
To control row counts, I introduced additional EXISTS clauses and nested logic. Parts of the query had to be repeated multiple times. Debugging became increasingly painful.
Then SQL Server 2014 arrived.
When the new Cardinality Estimator was introduced, some of these monster queries suddenly generated execution plans that were dramatically worse than before.
That was my wake-up call.
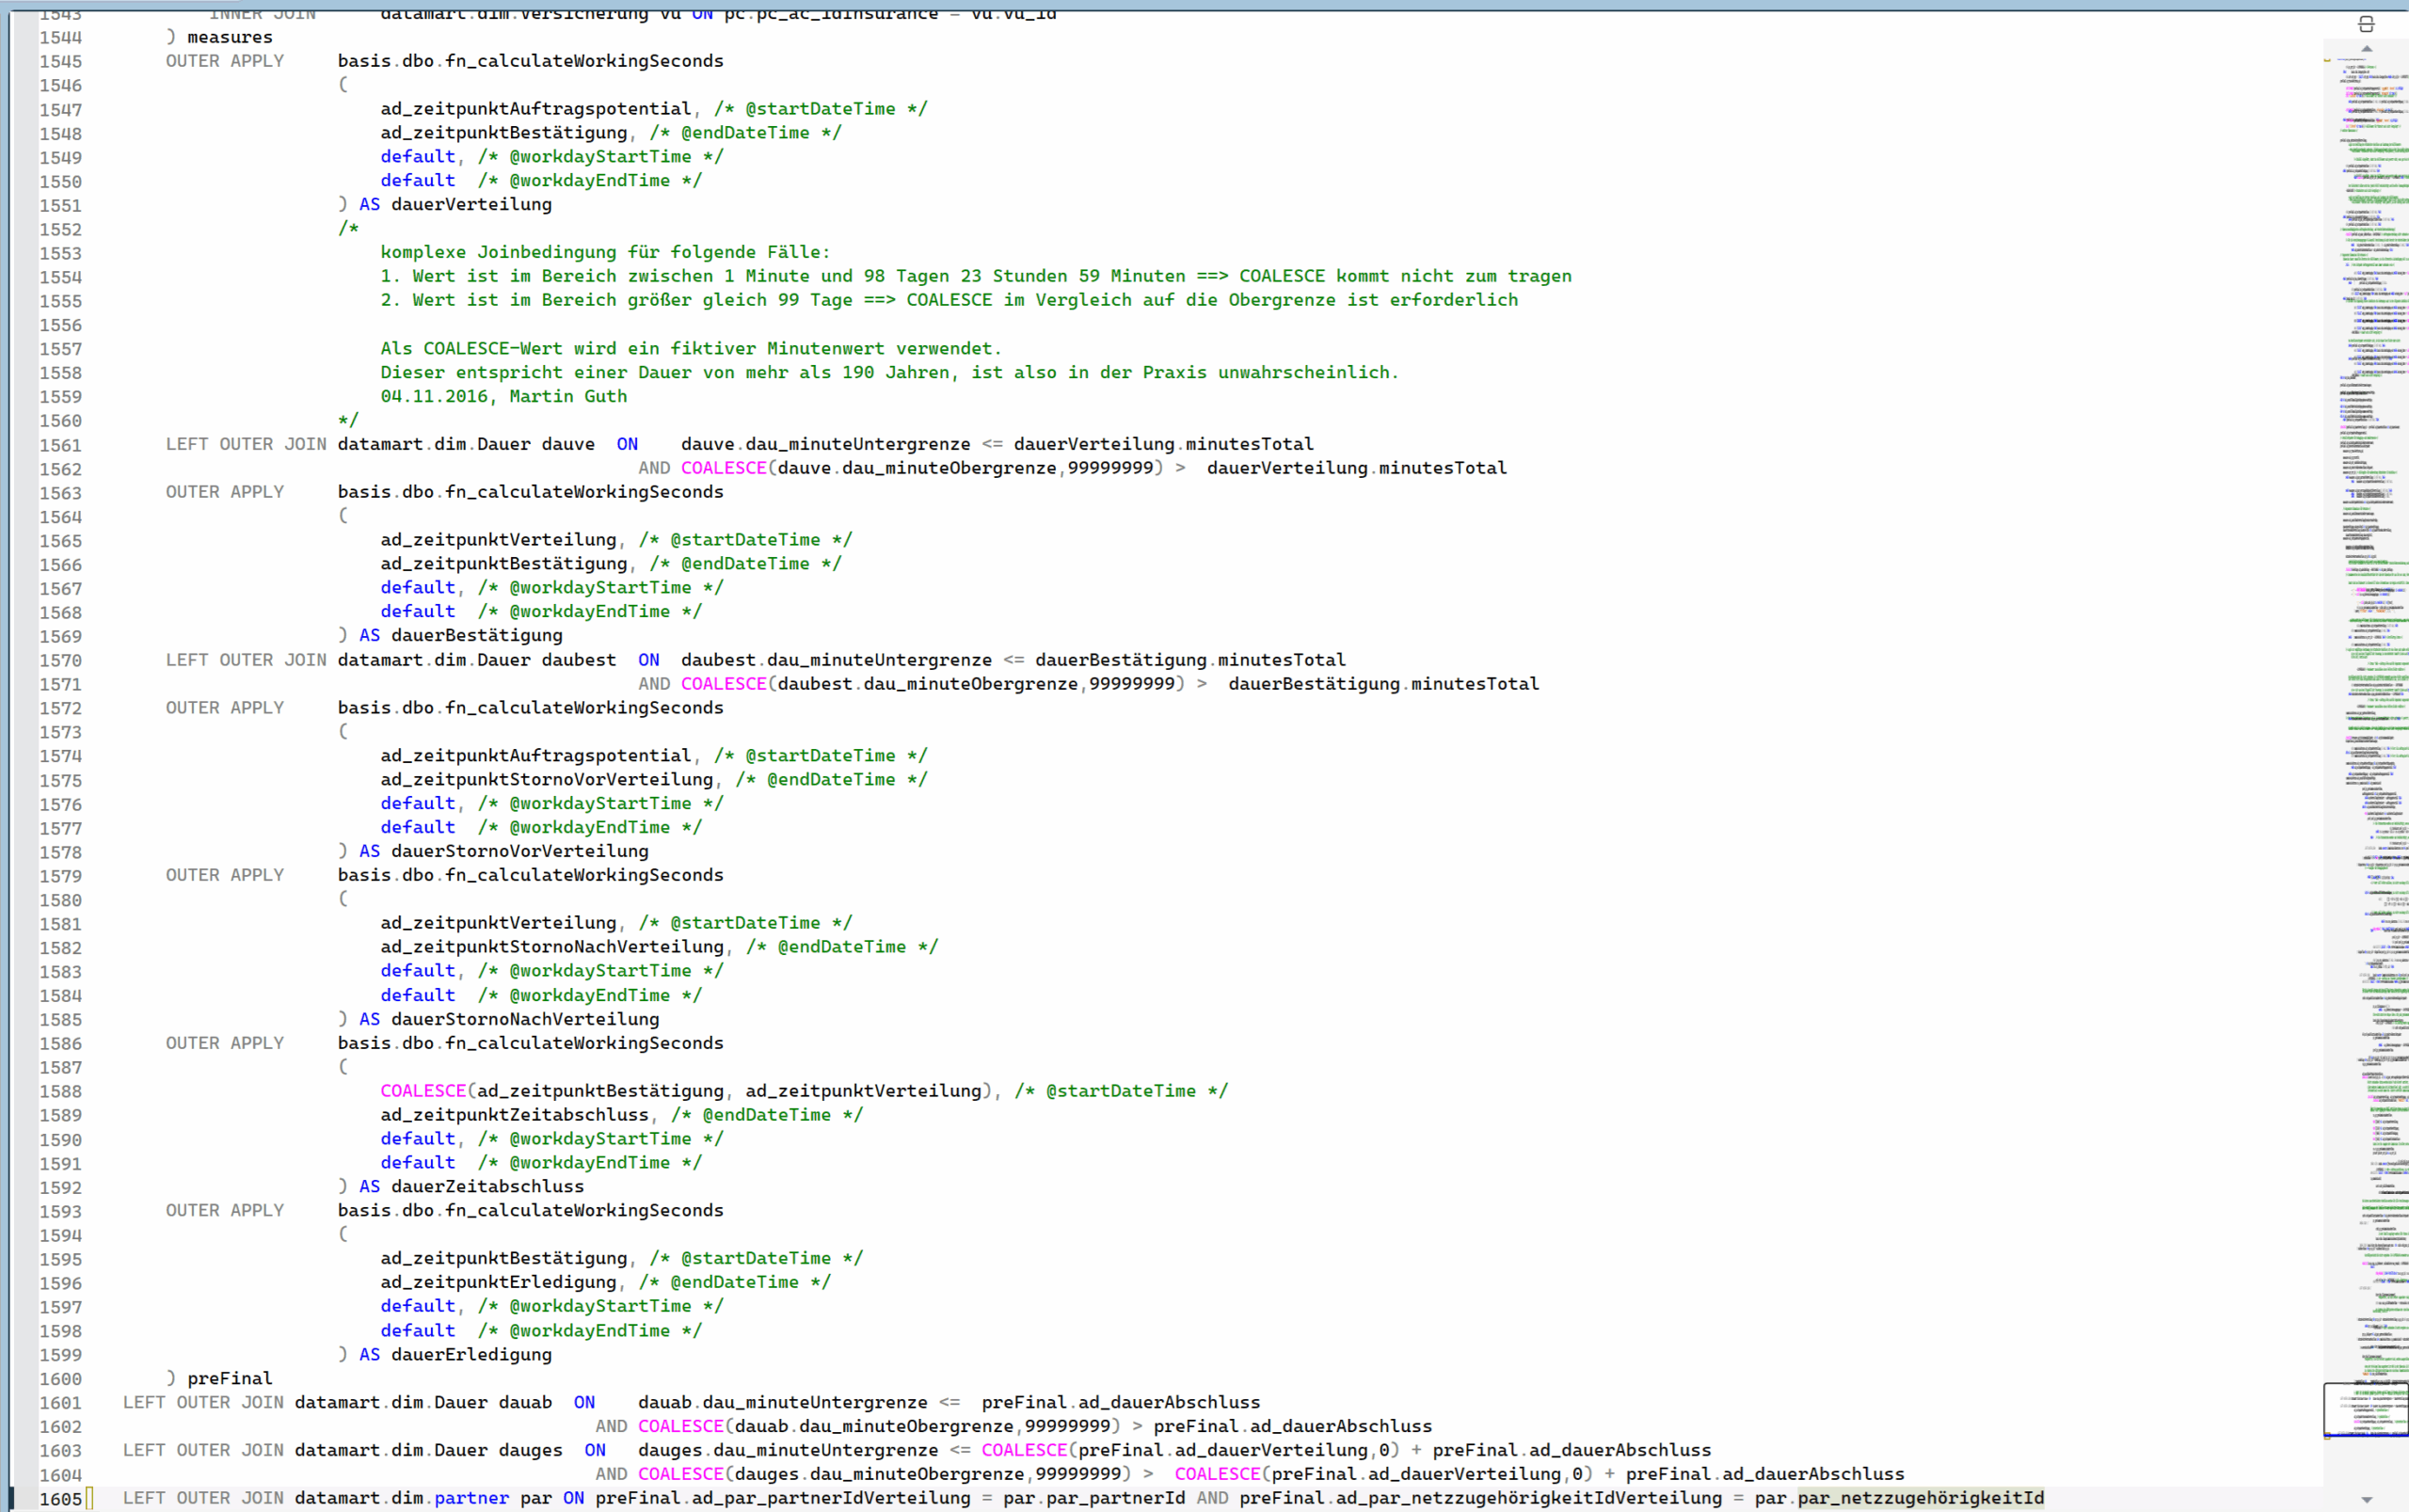
One ginourmous 1600 lines view with at least 3 levels of nested SQL.
Building Fact Tables Step by Step
Today I rarely build large fact tables using one enormous query.
Instead, I prefer a modular approach.
I typically start a stored procedure by creating one or more temporary tables.
Then I populate those tables step by step.
Each step joins together data that naturally belongs together. Intermediate results can be inspected easily. Special cases become much simpler to handle.
A simplified process might look like this:
CREATE TABLE #FactStage (...);

INSERT INTO #FactStage

SELECT ...

FROM TableA

JOIN TableB;

UPDATE #FactStage

SET ...

DELETE FROM #FactStage

WHERE ...
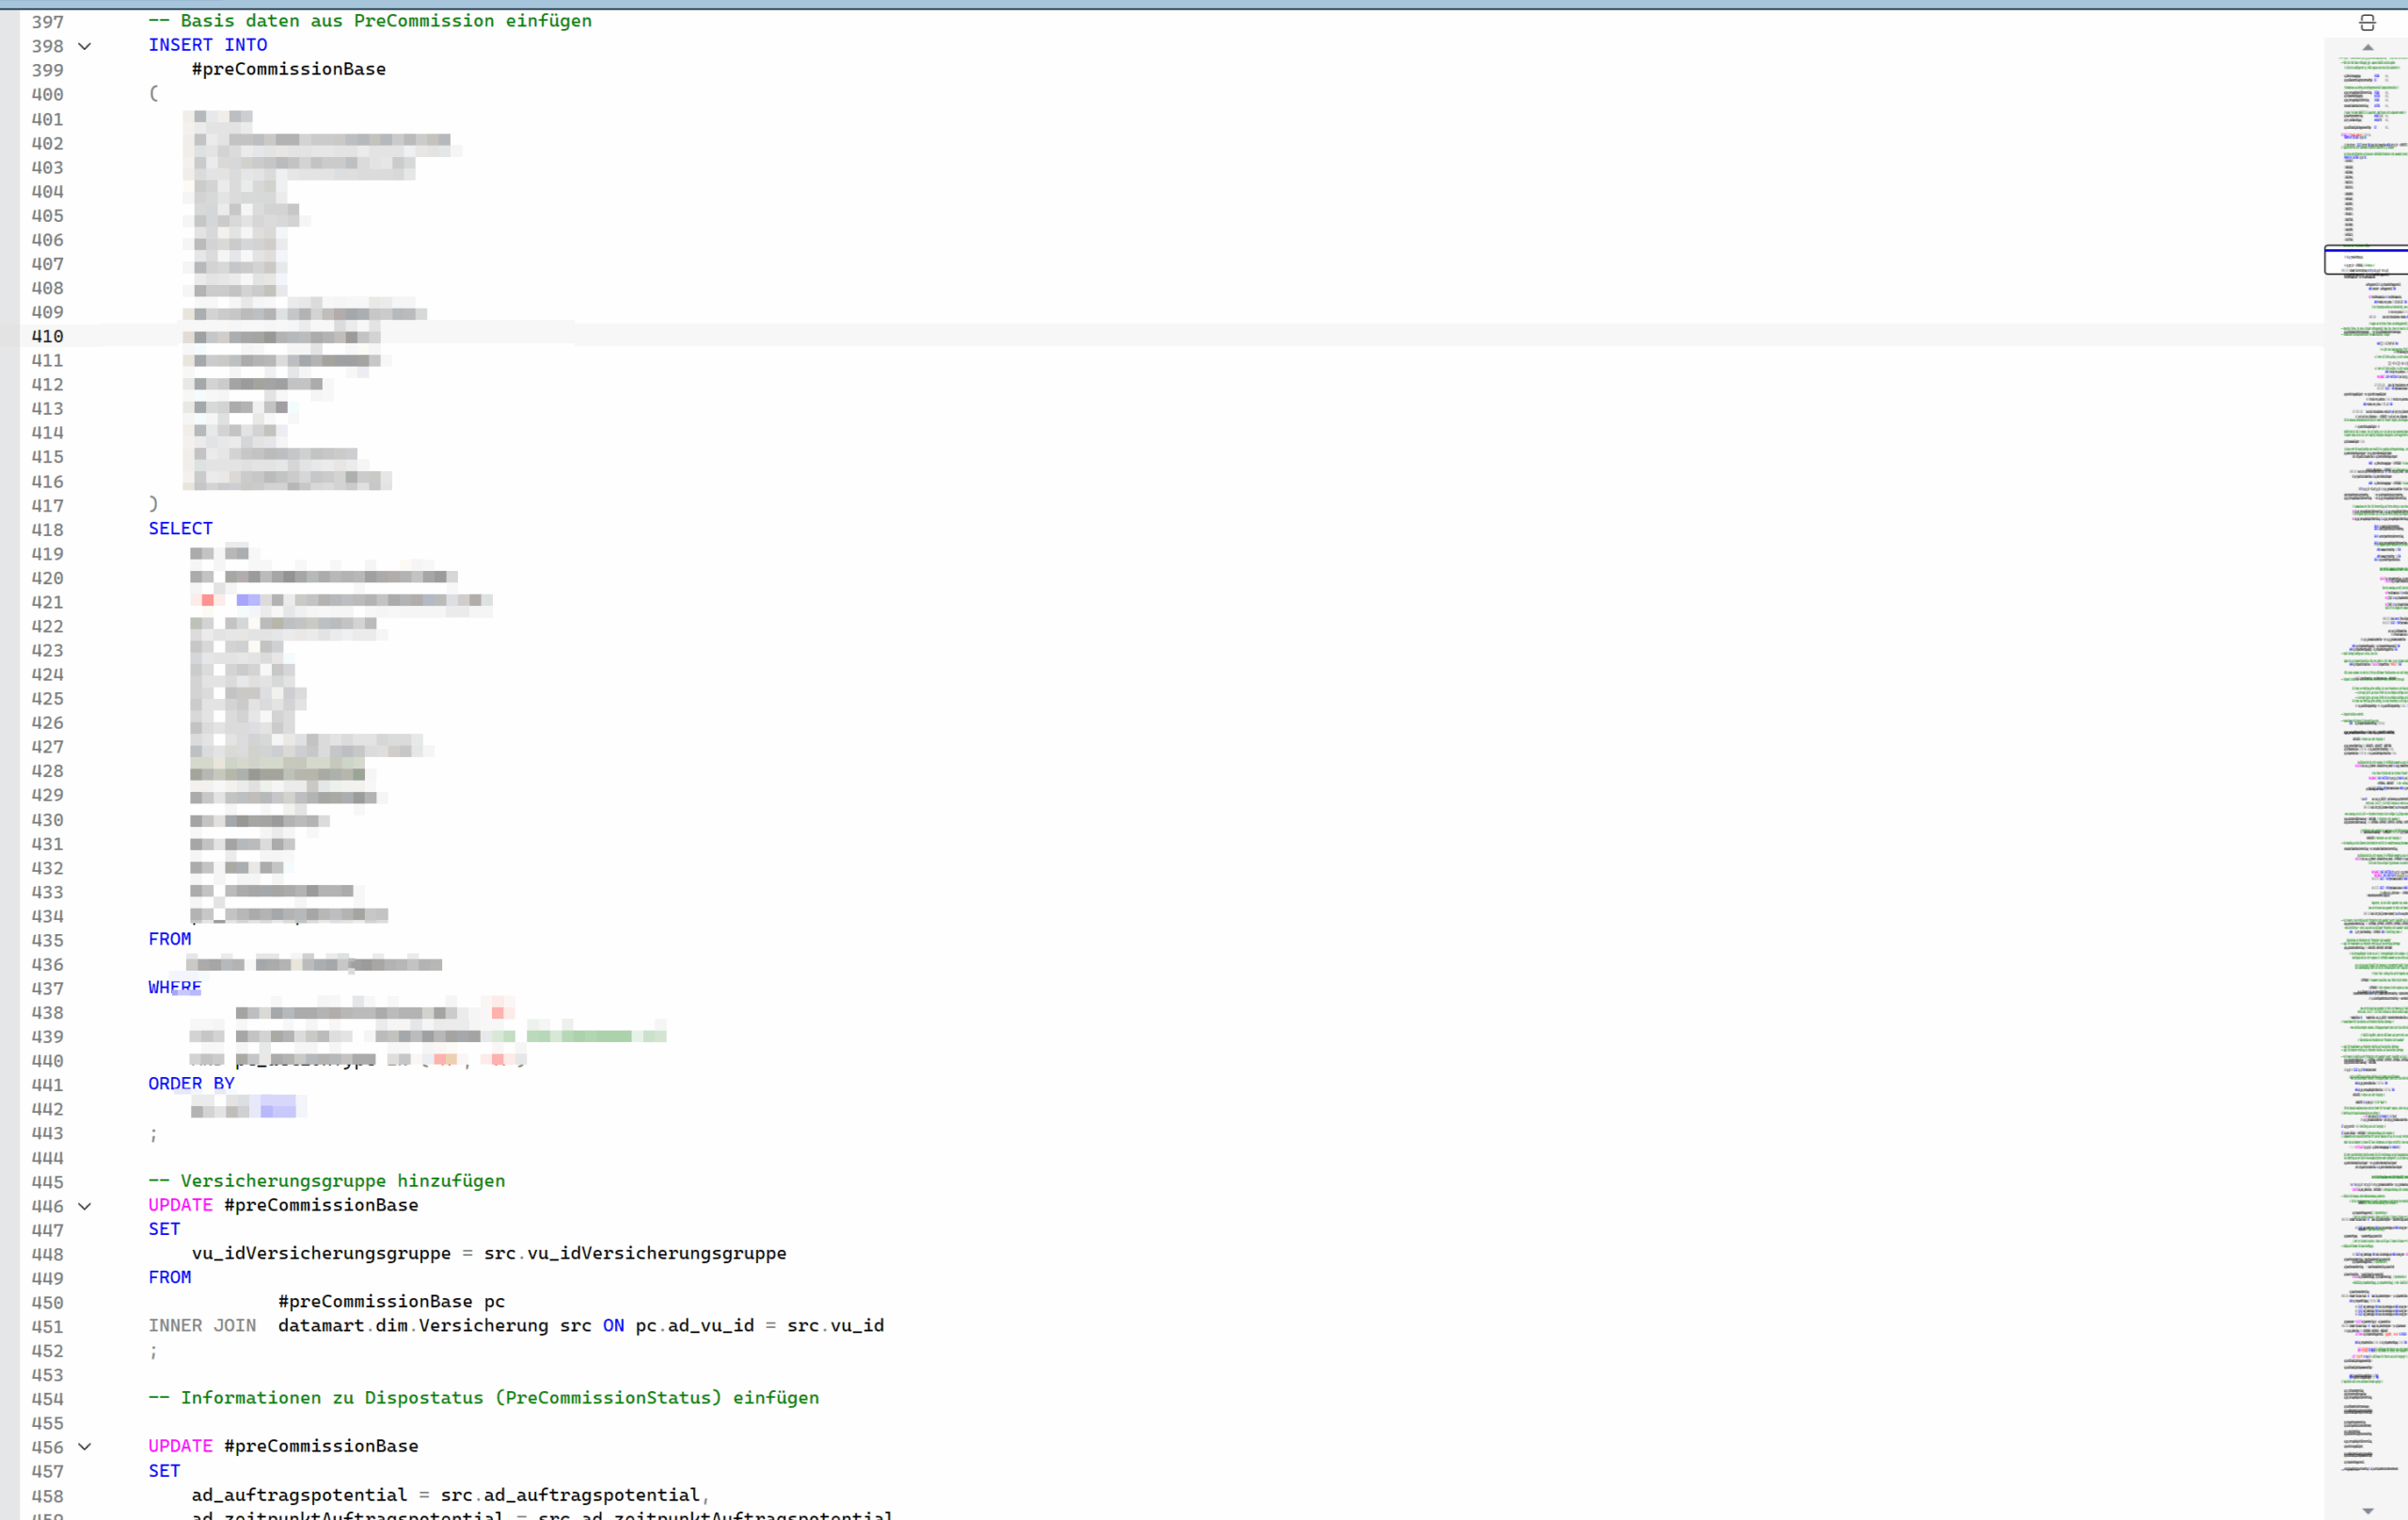
Procedure Style Alternative with manageable chunks of insert and updates
This approach provides several advantages:
- Smaller and more readable SQL statements
- Easier debugging
- Better visibility into intermediate results
- Simpler handling of exceptional business rules
- Often better execution plans
One possible downside is that a failure in the procedure typically aborts the entire process.
In practice, however, this has been a minor issue. During the last six years, I can remember fewer than four situations where this caused significant problems.
The ORM Challenge
Another place where I regularly encounter excessive join counts is ORM-generated SQL.
Object-relational mappers are extremely useful. They increase developer productivity and reduce the amount of handwritten SQL. For many projects, they are absolutely the right choice.
Problems usually begin when very complex object hierarchies meet automated SQL generation.
Object-oriented systems frequently use inheritance.
Consider the following simplified hierarchy:
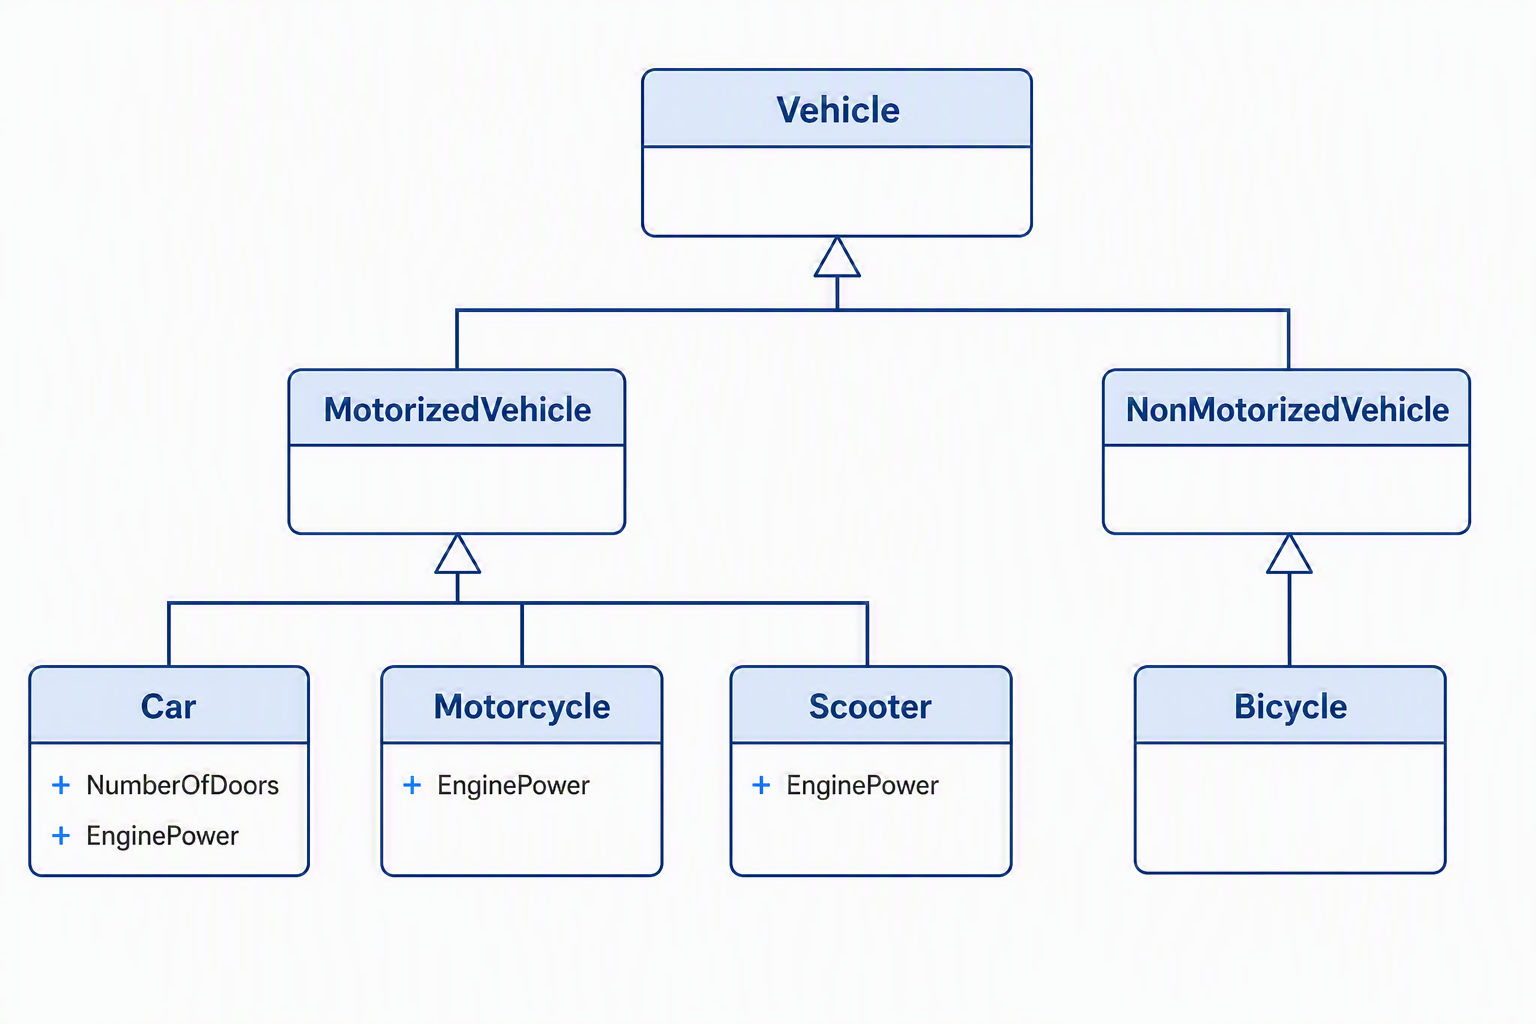
Notice that the class NonMotorizedVehicle does not even have its own properties.
When mapping such hierarchies to a relational database, there are typically two approaches.
Single Table Strategy
Everything is stored in one table.
This creates many columns, some of which remain empty for certain object types.
In extreme cases, sparse columns may be considered.
Table Per Class Strategy
Each class receives its own database table.
Using the hierarchy above, this quickly leads to a surprisingly large number of tables.
Some tables may contain nothing except the primary key because the corresponding class does not define any additional attributes.
While this design mirrors the object model nicely, it can create very complex SQL statements.
When Things Get Out of Control
One application that I support as a DBA uses a table-per-class inheritance strategy.
As a result, queries containing more than ten joins are completely normal.
When investigating performance problems, I often find execution plans showing:
StatementOptmEarlyAbortReason = TimeOut
The optimizer gives up before finding a really good join order.
The resulting plan may begin by reading an enormous amount of data. Later operations then become much more expensive than necessary because filtering happens too late.
The most extreme example I have encountered involved reloading an entity after saving a simple master data change.
The entity itself contained references to multiple parent objects, additional configuration objects, inherited properties, and numerous related entities.
The ORM generated a query joining more than 400 tables.
Yes, four hundred. All with nested loops.
The query required at least fifteen seconds to complete and the plan shape looked like this:

At that point, no indexing strategy in the world can fully compensate for the complexity involved.
The solution to this very specific problem was to control the cascade behavior in Hibernate JPA for the entities involved.
Final Thoughts
Large queries are not automatically bad.
However, every additional join increases the optimizer’s workload and makes execution plans harder to predict.
Whenever I see a query with more than ten joins, I start asking questions:
- Can the logic be broken into smaller steps?
- Can intermediate results be materialized?
- Is the data model introducing unnecessary complexity?
- Is an ORM generating SQL that no human would ever write?
Sometimes the answer is no and the query is justified.
But surprisingly often, splitting the problem into smaller pieces leads to SQL that is easier to understand, easier to debug, and significantly faster to execute.
That is usually a trade-off worth making.
Disclaimer
This article was created based on my personal notes with support from Microsoft Copilot. While Copilot assisted in structuring and refining the content, all technical details have been carefully reviewed and developed by me.
One thought on “#tsql2sday: When the Optimizer Runs Out of Time”